
Part IV of the Cognitive Work Architecture Series
By Alex Cuciurean | November 2026
The 7 AM Problem
Every morning, my Cloud Operations inbox contains somewhere between 50 and 200 Azure Monitor alert emails. Sev0s mixed with Sev3 noise. Fired alerts next to resolved alerts for the same VM. Duplicate notifications from threshold oscillations that fired, resolved, and re-fired while I was asleep.
I used to spend the first 45 minutes of every day doing the same thing: scanning emails, mentally grouping related alerts, identifying what actually needs attention, and writing a summary for leadership.
That’s 45 minutes of pattern recognition, prioritization, and reporting — every single day — before I even start making decisions.
So I hired Mara.
Meet Mara: Senior Azure Monitor Analyst
Mara is the fifth AI employee in my Cognitive Work Architecture. While Lia orchestrates executive workflows, Sara drives commercial strategy, Rakaesh handles technical architecture, and Andre synthesizes project intelligence — Mara does something deceptively simple:
She reads every alert email. She writes the brief. I read the brief.
Every morning at 08:00 UTC, I open one email instead of 139. It looks like this:
🔔 Daily Operations Digest Cloud Operations — Azure Monitor Alert Intelligence
⚠ ENVIRONMENT STATUS: DEGRADED — Action Required 2 Sev1 memory alerts remain open as of 08:00 UTC. All Sev0 VM availability outages are fully resolved.
| 139 Total Alerts | 12 Sev0 Critical | 2 Sev1 Still Open | ✓ All Sev0 Resolved |
In 30 seconds, I know: environment is degraded, two memory alerts need attention now, and last night’s critical outages self-healed. No scrolling through 139 emails. No mental triage. No missed Sev0 buried between informational noise.
That’s the point. Mara doesn’t replace monitoring. She replaces the cognitive labor of interpreting monitoring.
What Mara Actually Produces
The Daily Digest
Every 24 hours, Mara processes every alert that fired since her last report and produces:
1. Environment Status — A single line: Healthy, Degraded, or Critical. This is the first thing I see. If it says Healthy, I can skim the rest. If it says Degraded, I know exactly where to focus.
2. Executive Summary — Two paragraphs explaining what happened and why it matters, not just what fired. For example, when 5 production VMs went unavailable within a 5-minute window, Mara didn’t list them as 5 separate incidents. She wrote:
“All Sev0 critical outages self-resolved within 25–30 minutes with no manual intervention recorded — consistent with a transient platform-level event.”
That’s analysis, not regurgitation. She correlated the timing, noted the self-healing pattern, and pointed me toward Azure Service Health logs instead of individual VM diagnostics. That’s the difference between a dashboard and an analyst.
3. Patterns Detected — This is where Mara earns her title. From the raw alert data, she identifies:
- Cluster events — 5 VMs firing simultaneously = platform issue, not individual failures
- Threshold oscillation — A VM that resolves and re-fires 43 seconds later isn’t “resolved” — it’s a hysteresis problem
- Extended anomalies — A non-prod VM that was down for 9.5 hours probably isn’t a failure — it’s likely an unmanaged shutdown policy creating false Sev0 noise
- Alert volume trends — 139 alerts in 24 hours, with 62% being informational, means alert fatigue is a real and present risk
4. Prioritized Actions — Not just “investigate this.” Mara assigns urgency labels (IMMEDIATE / TODAY / THIS WEEK), identifies the specific resource, and recommends the diagnostic path:
“IMMEDIATE — Connect to the terminal server in the Services subscription. Run process analysis to identify memory-consuming workloads. Available Memory is at 19.97% and cycling. Consider restarting offending services, increasing VM memory SKU, or migrating workloads.”
That’s not an alert. That’s an operations brief.
The Weekly Summary
Every Monday, Mara produces a second report covering the full 7-day window. This is the one I forward to leadership. It includes everything the daily has, plus:
- Week-over-week trending — Are we getting better or worse?
- Resolution rate analysis — This week: 18.8%. Mara flagged this as “operationally unacceptable” and recommended immediate backlog triage. She’s right.
- Noisiest resources — The top 5 VMs generating the most alerts, with specific tuning recommendations per resource
- Cross-subscription correlation — When Prod and NonProd both have Sev0 events in the same week, Mara connects them and suggests shared root cause investigation
The weekly report this week opened with:
“The cloud environment operated in a DEGRADED state. 1,051 alerts were recorded with 186 Sev0 Critical alerts representing 17.7% of total volume. The overall resolution rate stands at a critically low 18.8%, leaving 655 alerts in an unresolved state.”
That paragraph would have taken me an hour to calculate manually. Mara produced it at 08:00 while I was still making coffee.
What a Real Daily Digest Looks Like
Here’s an anonymized excerpt from an actual daily digest Mara delivered. The structure, analysis, and recommendations are real — the resource names have been changed.
Alert Overview
Severity Total Fired Resolved Still Open Sev0 — Critical (VM Unavailable) 12 6 6 0 Sev1 — Error (Memory >80%) 3 2 1 2 Sev2 — Warning ~124 — — — TOTAL 139 2 🔴 Prod VM Cluster Outage — 5 VMs Simultaneously Unavailable
Five production VMs fired within a 5-minute window (05:25–05:30 UTC) and all resolved within ~27 minutes. The simultaneous, clustered nature strongly indicates a platform-level event rather than individual VM failures.
Virtual Machine Fired Resolved Duration Availability at Fire prod-mfg-app01 05:25 05:51 ~26 min 0.00 prod-mfg-app02 05:25 05:50 ~25 min 0.50 prod-mfg-mq01 05:25 05:51 ~26 min 0.00 prod-mfg-mq02 05:30 05:57 ~27 min 0.75 prod-mfg-mq03 05:26 05:51 ~25 min 0.33 ✅ STATUS: All 5 VMs RESOLVED. Confirm root cause via Azure Service Health and Activity Logs.
🟠 Memory >80% — Terminal Server — OPEN
Resolved: 06:36 UTC → Re-fired: 06:37 UTC (43 seconds later) Available Memory at fire: 19.97% | Threshold: < 20%
⚠ STATUS: OPEN — Rapid cycling at threshold boundary. Memory pressure is not resolving.
Patterns Detected
🔁 Cluster Event — 5 Prod VMs fired simultaneously. Strong indicator of Azure platform event. All self-healed within ~27 minutes. Correlate with Azure Service Health portal.
⚡ Threshold Oscillation — 2 VMs cycling at the 20% memory boundary. Classic hysteresis problem — either the threshold is too tight, or these VMs are chronically under-provisioned. Flag for threshold tuning to 15%.
📊 High Alert Volume — 139 alerts in 24 hours. The majority of Sev0 events are fire/resolve pairs indicating transient, self-healing conditions. This volume inflates alert fatigue risk.
Recommended Actions
- IMMEDIATE — Investigate the terminal server memory cycling. Available Memory at 19.97% and not recovering.
- TODAY — Review Azure Service Health for the 05:20–06:00 UTC production cluster event. Document finding for incident record.
- TODAY — Confirm with the managed services team whether the 9.5-hour non-prod downtime was intentional. If scheduled, implement alert suppression.
- THIS WEEK — Tune memory alert threshold from <20% to <15% for VMs exhibiting oscillation.
That’s one email. One read. Every morning. Built with tools you already own.
How Mara Works — The Architecture
Mara runs on Power Automate, Dataverse, and a Copilot Studio agent. No custom code. No additional licensing. No external APIs.
Layer 1: Alert Ingestion
Azure Monitor sends alert emails. A Power Automate flow triggers on every incoming alert and:
- Converts the HTML email body to structured text
- Extracts key fields: Alert Name, Resource Name, Resource Group, Subscription, Severity, Status
- Writes each alert as a row into a Dataverse custom table
This flow runs 24/7. Every alert that hits the inbox becomes a structured, queryable record. The raw email is noise; the Dataverse row is signal.
Layer 2: Digest Generation
A second flow runs on a schedule — daily at 08:00 UTC, weekly on Mondays:
- Recurrence trigger fires at the scheduled time
- Calculates the lookback window (24 hours or 7 days)
- Queries Dataverse for all alerts within the window
- Condition check — if zero alerts, sends a “Clean environment” email and terminates
- If alerts exist:
- Transforms raw rows into a structured summary payload
- Executes the Mara agent with the full dataset
- Wraps Mara’s analysis in a formatted HTML email
- Delivers the digest
The critical step is “Execute Agent and Wait.” This is where raw data becomes intelligence. Mara’s agent receives the full structured alert dataset and produces the executive summary, pattern analysis, and recommended actions.
Layer 3: The Agent
Mara’s agent is configured as a Senior Azure Monitor Analyst. Her instructions define how to:
- Classify environment status (Healthy / Degraded / Critical) based on open Sev0/Sev1 counts
- Group related alerts by time proximity, resource group, and subscription
- Identify patterns: cluster events, threshold oscillation, extended anomalies
- Produce prioritized actions with urgency labels and specific diagnostic steps
- Write for an executive audience — analysis, not data dumps
She’s not monitoring. She’s reporting on monitoring. The distinction matters: Azure Monitor watches the infrastructure. Mara watches Azure Monitor and tells me what it means.
What Changed After Mara
| Before Mara | After Mara |
|---|---|
| 45 min/day scanning alert emails | 5 min/day reading one digest |
| Patterns discovered reactively (after incidents) | Patterns surfaced proactively (before escalation) |
| Weekly leadership report written manually on Fridays | Weekly report auto-delivered Monday 08:00 |
| Alert fatigue — Sev3 noise drowning Sev0 signal | Noise quantified and flagged for tuning |
| “How many alerts did we have?” → manual count | 1,051 alerts, 186 Sev0, 18.8% resolution rate — instant |
The 45 minutes I saved every morning isn’t the real win. The real win is that Mara catches things I would have missed. The 43-second re-fire cycle on a terminal server. The correlation between two production VMs going down 5 minutes apart. The 9.5-hour non-prod outage that nobody asked for.
Those are the patterns that prevent next week’s incident. And they were buried on page 3 of an inbox I was already skimming too fast.
The Bigger Picture
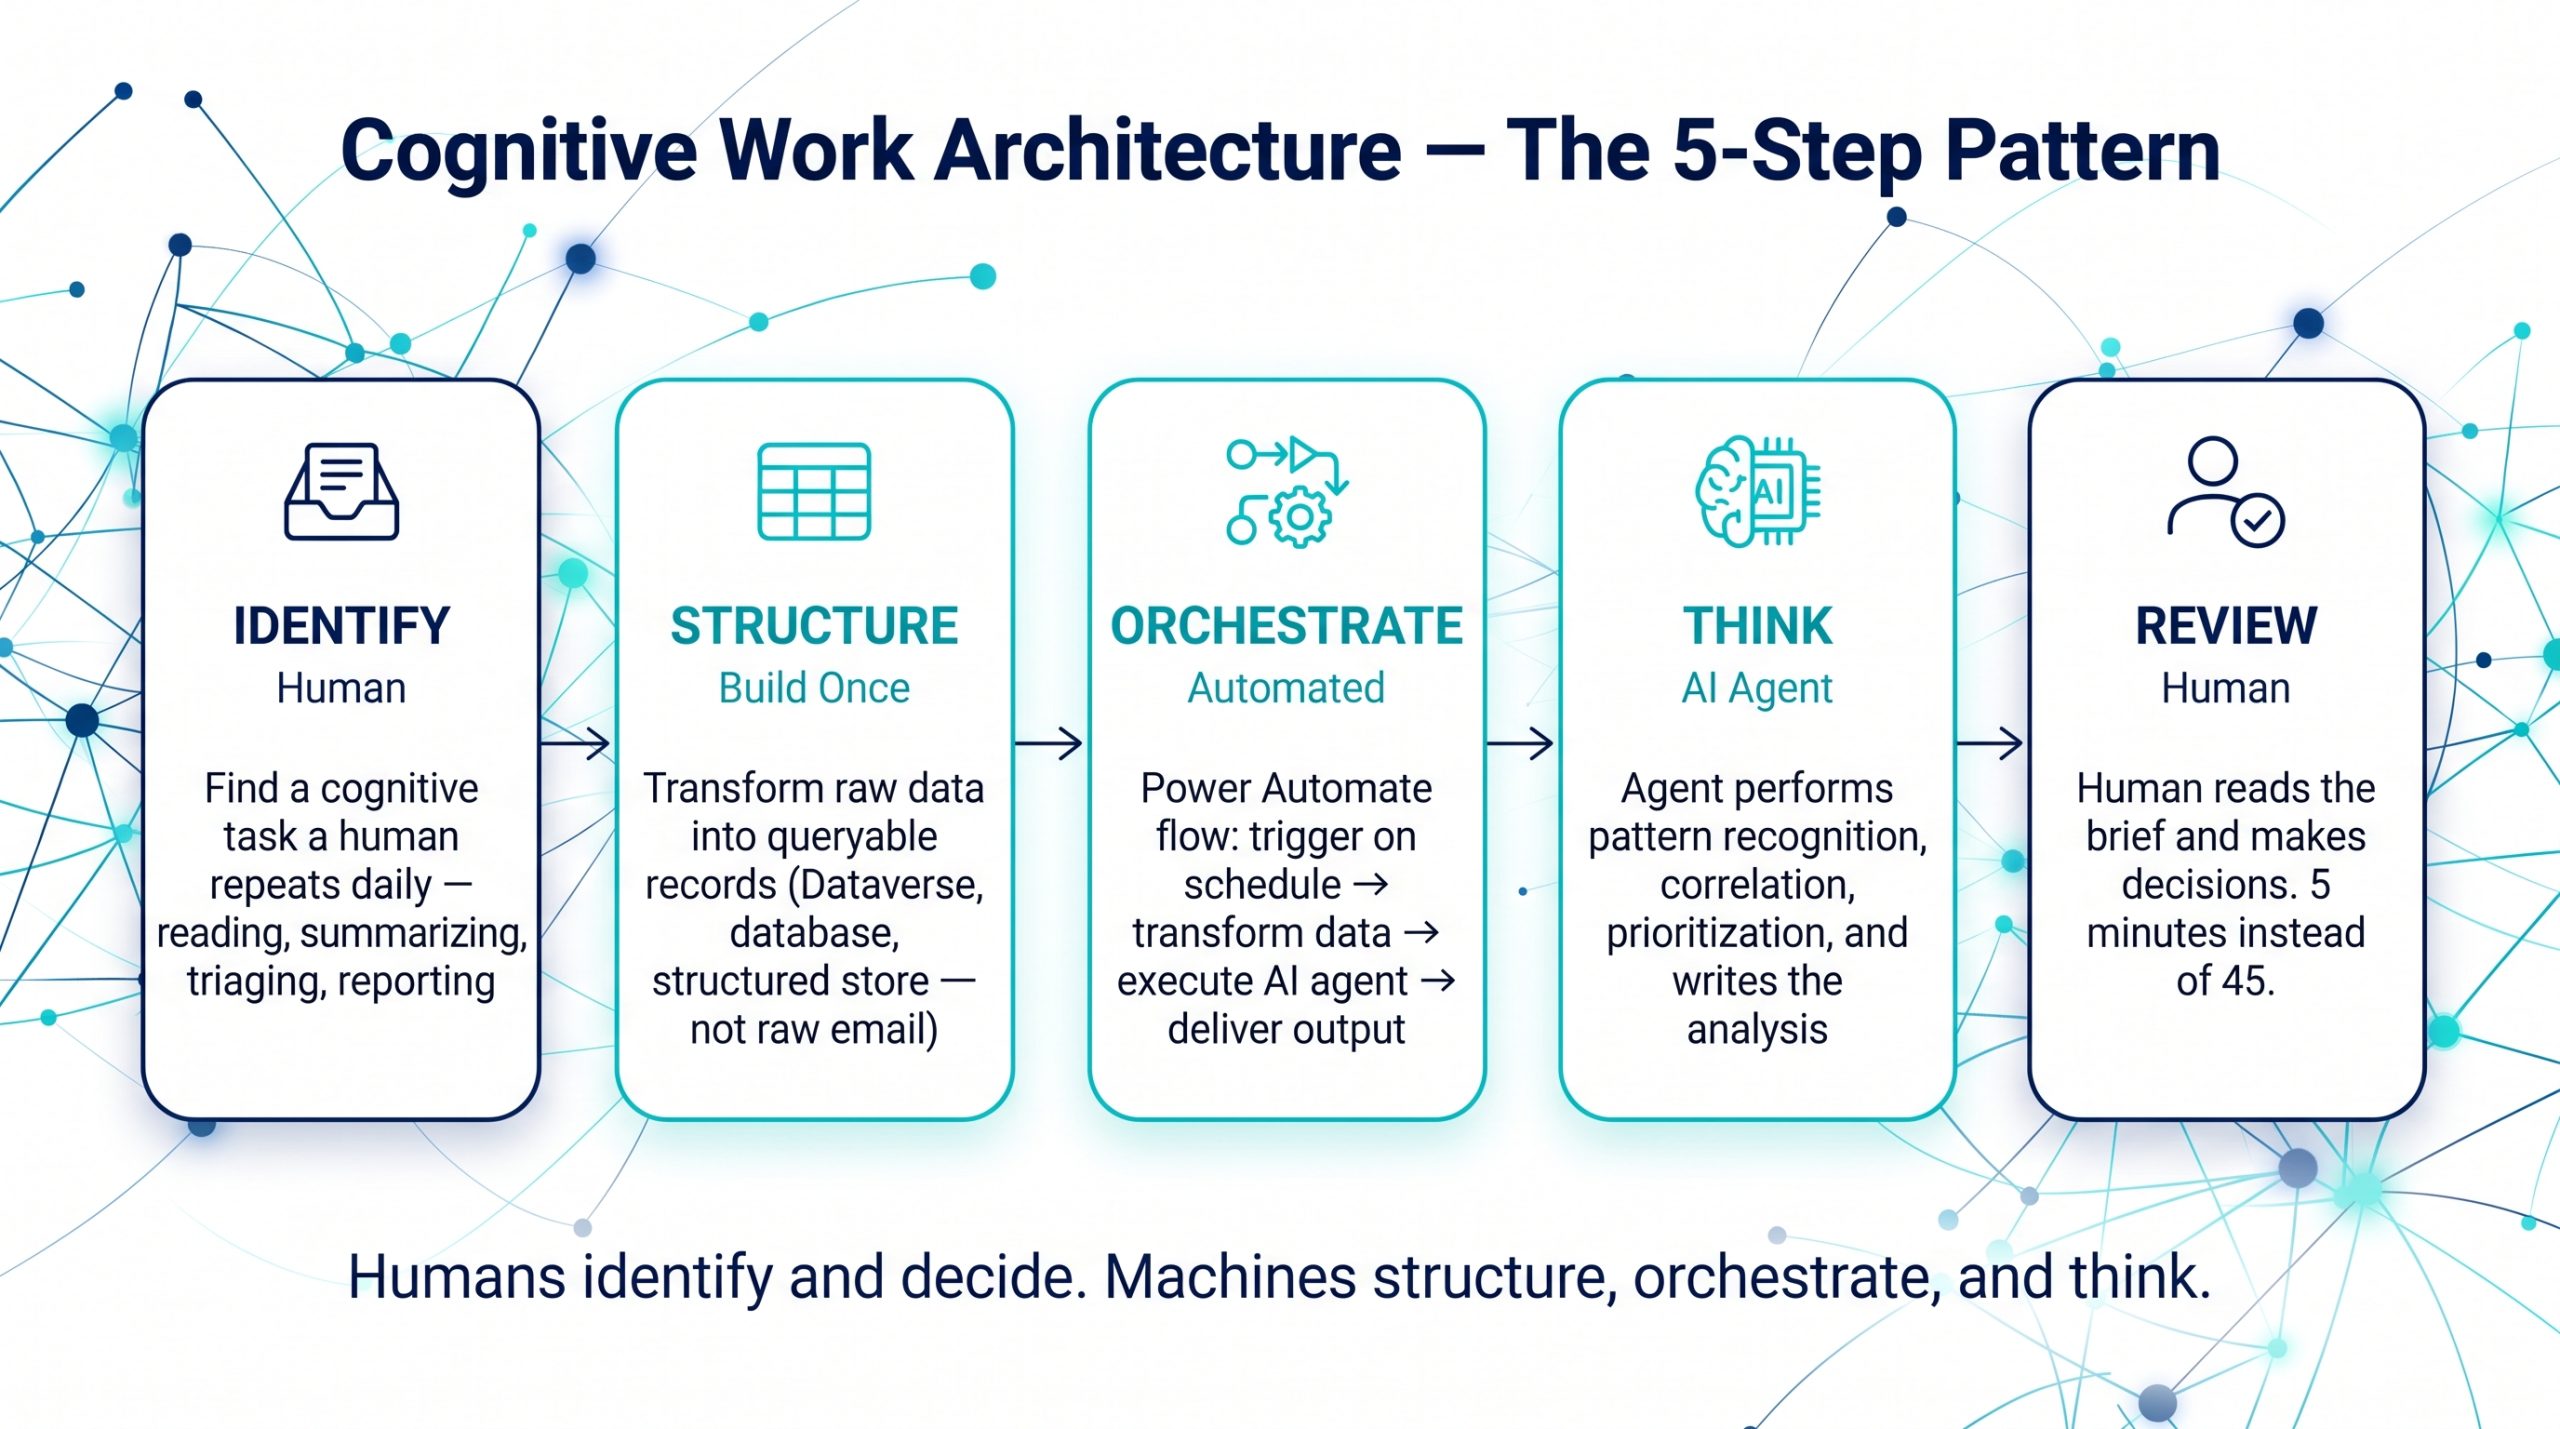
Mara is the fifth agent in a system I’ve been building and writing about since August 2026. The pattern is always the same:
- Identify a cognitive task that a human repeats daily — reading, summarizing, triaging, reporting
- Structure the data so an AI agent can consume it (Dataverse, not raw email)
- Build the orchestration in Power Automate — trigger, transform, execute agent, deliver
- Let the agent do the thinking — pattern recognition, correlation, prioritization
- Human reviews the output — 5 minutes instead of 45
Mara isn’t special because she’s AI. She’s special because she’s the right AI for the right task, connected to the right data, delivering at the right time.
Any enterprise with Microsoft 365, Power Automate, Dataverse, and Copilot Studio can build their own Mara this week. For any data source. For any operational domain. The tools are already in your tenant.
The question isn’t whether you can afford to build this. It’s whether you can afford another quarter of your senior people spending their first hour every day reading emails that a machine should be summarizing.
This is Part IV of the Cognitive Work Architecture series. Previously: I Hired Four AI Employees Last Month. They Cost $0 and Never Sleep. → My AI Employees Got Promoted. Here’s What Changed. → The Org Chart Trap: Why Your Target Operating Model Is a Photograph of Yesterday.
Architecture patterns and prompt templates coming to GitHub in two weeks.
Alex Cuciurean builds Cognitive Work Architectures for enterprises using the tools they already own.